

Why Data‑Driven Product Prioritization Matters
In B2B environments the cost of shipping a feature that does not move the needle on revenue or customer retention is high. Decision‑makers need a way to justify engineering effort with concrete business impact. By grounding product prioritization in observable data—usage patterns, conversion rates, churn signals—we turn intuition into a repeatable process. The result is a shorter feedback loop, clearer stakeholder alignment, and a measurable reduction in time‑to‑market for high‑value features.
Translating Business Goals into Scorable Value
The first step is to articulate the strategic objectives that matter most: ARR growth, net‑revenue retention, market expansion, or operational efficiency. Each objective is then broken down into leading indicators that can be captured in a data pipeline (e.g., trial‑to‑paid conversion, feature adoption rate, support ticket volume). By assigning a numeric target to each indicator, we create a common language that bridges product, finance, and engineering. This quantitative foundation makes the subsequent scoring models meaningful and comparable.
Core Prioritization Models
RICE
RICE (Reach, Impact, Confidence, Effort) remains a favorite for teams that already track usage metrics. Reach estimates how many customers a feature will affect, Impact quantifies the expected change in a key metric, Confidence reflects data quality, and Effort is expressed in person‑weeks. The formula produces a single score that can be ranked across the backlog.
MoSCoW
MoSCoW (Must, Should, Could, Won’t) is a categorical approach that works well when regulatory or contractual obligations dominate the decision space. While it does not produce a numeric score, coupling MoSCoW tiers with data‑derived impact estimates helps avoid the “must‑have” trap where low‑value work is over‑prioritized.
WSJF
Weighted Shortest Job First (WSJF) originates from SAFe and is ideal for environments where cycle time is a primary constraint. WSJF calculates Cost of Delay divided by Job Size. Cost of Delay can be expressed using revenue‑impact forecasts derived from the same metrics that feed RICE, making the model data‑rich without adding complexity.
Building the Data Pipeline for Feature Metrics
A lightweight pipeline is sufficient for most B2B product teams. Start with event tracking in the application (feature toggles, click streams, API calls) and funnel those events into a centralized analytics store. Augment raw events with business‑level enrichments—customer tier, contract value, renewal date—so that each metric can be weighted by its revenue relevance. Regularly export aggregated results to a spreadsheet or BI tool where the prioritization models can be applied. The key is automation: schedule nightly jobs that refresh the metric tables, ensuring the scoring inputs are always current.
Aligning the Roadmap with Revenue Impact
Once each feature has a score, map the ranked list onto a quarterly roadmap. Group high‑scoring items into a “Revenue‑Accelerating” band and allocate a fixed capacity slice (e.g., 30% of engineering bandwidth) to that band each cycle. The remaining capacity can address technical debt, compliance, or exploratory work. By explicitly tying capacity to expected revenue impact, you create a transparent trade‑off that senior leadership can audit.
Leveraging a Build Partner for Continuous Insight
A trusted build partner can extend your data capabilities without pulling core engineers away from delivery. They can:
- Implement and maintain the event‑collection layer, ensuring consistent schema across services.
- Provide a managed analytics environment that scales with data volume.
- Run the scoring models on a recurring basis and surface the results in a shared dashboard.
- Offer rapid experimentation support, allowing you to A/B test feature hypotheses and feed the outcomes back into the prioritization loop.
Because the partner handles the operational overhead, your internal team stays focused on interpreting the insights and making strategic trade‑offs.
Putting It All Together: A Practical Workflow
The end‑to‑end loop we recommend starts with business goals, flows through data collection, scores features, updates the roadmap, and then measures impact to restart the cycle. The following flowchart captures that process.
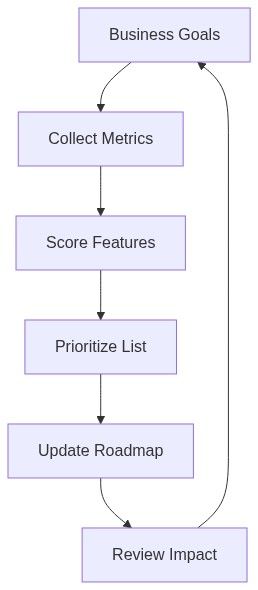
By iterating on this loop each quarter, teams can quantify the revenue lift of each release, identify lagging metrics early, and re‑prioritize before engineering capacity is locked in. The disciplined use of data‑driven product prioritization therefore becomes a lever for consistently cutting time‑to‑market while ensuring every shipped feature contributes to the company’s top‑line objectives.